What are tourism statistics?
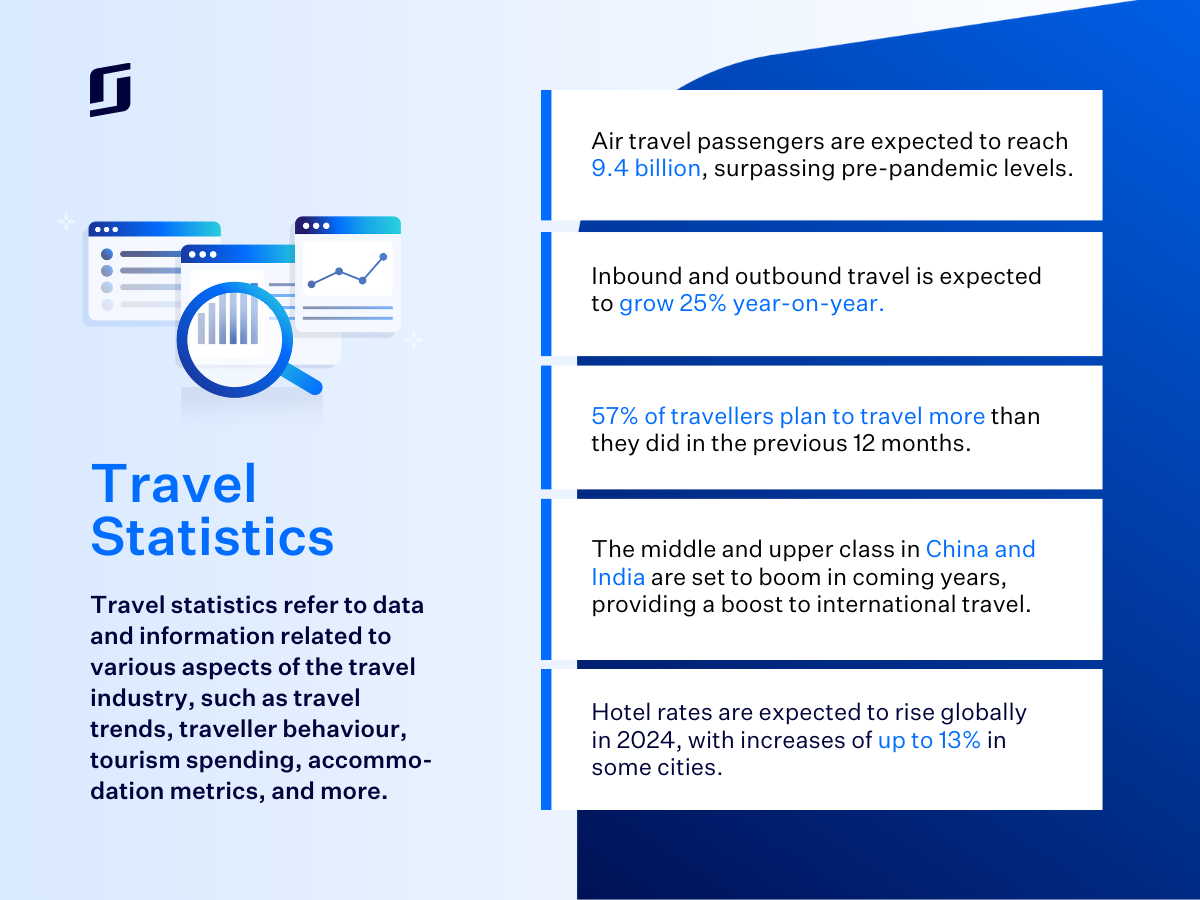
Tourism statistics refer to data and information related to various aspects of the travel industry, such as travel trends, traveller behaviour, tourism spending, accommodation metrics, and more.
These statistics provide valuable insights into the current state of the industry and help inform future strategies for hoteliers and accommodation providers.
Travel stats might include travel volume, popular destinations, travel spending, occupancy rates and other accommodation data, transport stats, traveller demographics and motivations, and other insights such as trends around sustainable travel.
Hoteliers can use statistics to understand their guests better, forecast demand, create offers based on current trends, and optimise their pricing and revenue strategies.
This blog will take you through some of the major tourism statistics and data that you should be focusing on for 2025 and beyond.
*Data appearing is sourced from external and internal resources
Table of contents
Travel and tourism statistics in 2025
The outlook for next year is a promising one for travel. Projected statistics show that the industry will continue its recovery from the COVID-19 era and other economic factors.
Some highlights include:
- Total cross-border trips are expected to number roughly 1.46 billion in 2025.
- 280 million households are expected to be travelling internationally as of 2025.
- 72% of travellers plan to venture abroad in 2025, up from 65% in 2024.
- Japan is the most popular destination (13%), with those from Thailand and Indonesia especially likely to book there.
- Hotel rates are expected to continue their rise globally in 2025, but will be moderate when compared to 2024.
Now let’s look at some current tourism statistics in more detail.
Turn statistics into revenue for your hotel
To act strategically on the data you collect, you need a hotel platform like SiteMinder to provide sophisticated booking, revenue, and management capabilities.
Learn more
Statistics about travel demographics
Statistics about travel demographics can be particularly useful for your hotel, as it allows you to target your marketing more effectively, plan your offers, and prepare satisfying guest experiences – all in the mission of maximising your reputation and profit.
Whether your hotel caters to young travellers, solo travellers, or families, there are always insightful stats to pay attention to.
Solo travel statistics
Solo travel is becoming more popular all the time, since it allows for flexibility and affordability.
Here are the most interesting statistics about solo travellers:
- Solo travel remains popular, with 24% of Brits planning to travel solo in 2025.
- Europe is a top destination for solo travellers with 30% planning to visit on their next trip.
- At 22%, hostel/motel/budget accommodation is the most popular with solo travellers.
- Only 14% of solo travellers choose to travel and stay in the luxury segment.
- Driven by the popularity of solo travel, the tours and activities sector will be worth $300 billion in 2025.
- Around 60% of solo travellers say they travel alone because they ‘don’t want to wait on others.’
Millennials travel statistics
Millennials are avid travellers, being in between their late 20s to early 40s. This usually means they have established themselves and have an income that allows them to take trips more regularly.
Here are some stats you may find useful:
- More millennials are choosing luxury accommodation, with 21% choosing to stay in this type of property.
- Just as many millennials (36%) will choose a superior room as a standard room in 2025.
- 32% of millennials will begin their trip research via a search engine.
- An online booking website or app is the preferred booking method for 47% of millennials.
- Almost 50% of millennials and Gen X prioritise experiences over ‘ticking off’ destinations.
Gen Z travel statistics
Gen Z are younger, being in their teenage years and early 20s, but those who travel are extremely savvy and conscious.
Here’s a list of important Gen Z travel statistics:
- More than two-thirds of Gen Z travellers have abandoned a booking because of a bad online experience.
- 58% of Gen Z plan to spend more or considerably more money on their next trip.
- Demand-based pricing is not a deterrent for Gen Z, with only 6% disagreeing with the practice.
- 17% of Gen Z and Millennials cite TikTok as a source of travel inspiration, and 27% say the same for Instagram.
- Gen Z are travelling more than other generations, but are also more concerned about the environment.
Family travel statistics
Family holidays are a staple of society, and many hotels and resorts in popular destinations cater explicitly to families. Generally, travel intent for families is higher now than in previous years, as a rebound occurs.
But what do the statistics say about family travel?
- 55% of those travelling with family will spend most or a considerable amount of time at their accommodation.
- A discount (48%) is the most popular hotel deal or offer for those travelling with family, followed by an exclusive-rate room upgrade (28%).
- 71% of Gen Z and Alpha generations are now taking the lead in family travel plans.
- 35% will plan their trips around major events and experiences such as the FIFA World Cup, followed by nature-based activities like camping or skiing (30%), and music concerts or festivals (28%).
- 47% of travellers are opting for multigenerational or family trips in 2025
Female travel statistics
Female travellers are a huge market – females travel solo, travel together, and are largely responsible for planning the trips that they take with their partners or families.
Hoteliers will be interested in the following statistics on female travellers:
- Female travellers are more likely to spend extra money on spa amenities (22% vs 20%) and less likely to spend extra on breakfast (46% vs 49%)
- When travelling for a concert or event, 60% of female travellers will book their accommodation immediately or within a week of purchasing their ticket.
- Female travellers represent 70% of hotel website visits.
- They also represent 71% of solo travellers.
- Among women aged over 50, adventure travel is the most popular type of trip.
Pet travel statistics
While pet travel can be divisive – not all travellers want to share their accommodation with furry friends – it is becoming increasingly common. Many accommodations now adopt pet-friendly policies.
Here are some of the latest pet travel statistics:
- 46% of travellers say that pet-friendly amenities and policies are more important or much more important than last year.
- 97% view their pet as part of the family, while 51% see them as equal to any other family member.
- Of those aged 18-34, 38% report that they often travel with pets.
- 25% of solo travellers will take their pets on trips, compared to the average leisure travellers at 19%.
- The pet tourism services market is expected to be worth USD 8.4 billion by 2035.
Travel and tourism data from around the world
Travel data can be even more helpful when it drills into particular markets. Depending on which markets your hotel commonly attracts, you can use country-based data to prepare more personalised offers.
Here are some stats from nations that travel the most or are popular travel destinations.
US tourism statistics
The US is both a huge destination for travellers to visit and a nation that travels to other places in large numbers. Here are a few statistics we think you should know:
- 36% of travellers from the US will begin their trip research using a search engine.
- US travellers are most likely to book online via an online booking website or app (32%), ahead of online via the accommodation’s website (23%).
- The US tourism sector is expected to be worth $11.94 billion.
- Inbound travel volume to the US is expected to grow by 9.5% in 2025 to hit 85.2 million visits.
- US domestic tourism is expected to exceed pre-pandemic levels in 2025.
UK tourism statistics
The UK is certainly a tourist hotspot, both domestically and for international visitors.
Here’s what data to stay on top of:
- 36% of UK travellers plan to spend more or considerably more compared to last year.
- Breakfast (45%) is the most popular hotel add-on for UK guests.
- Only 23% of UK travellers disagree with hotels using demand-based pricing strategies.
- 69% of UK travellers plan to take an international trip in 2025.
- 47% of UK guests have stated they take their kids to the same places they visited as children.
France tourism statistics
Ever a busy hub for travel, it’s rare for tourism in France not to be booming.
Here are the tourism statistics that stand out:
- While OTAs are the preferred method of booking for 37% of French travellers, this preference is lower amongst its international source markets with the UK at 30%, 31% for Italy and 33% for Germany.
- 26% of French guests will be looking to book a longer stay on their next trip.
- 30% of French guests will spend most or a considerable amount of their time at their accommodation.
- France is expected to attract 93.7 million international visitors in 2025.
- The French hotel market is expected to grow by 2.76% by 2029.
Italy tourism statistics
Italy is one of the most popular destinations in the world, with rich history, culture, and cuisine.
Here are the best stats about Italian tourism and about Italian travellers:
- Responding to rising prices, 25% of Italian travellers said they would combat this by sticking with their preferred accommodation but choosing a cheaper room.
- 61% say they are more likely to travel for an event this year, with the most common reason being a concert/music festival (21%).
- 48% say the most appealing hotel offer/deal is a discount.
- Italy’s tourism market is set to be worth over USD 27 billion by 2029.
- In Italy, arrivals from North America and the Asia-Pacific regions will drive significant tourism growth over the short-to-medium term.
Thailand tourism statistics
Thailand is an exotic, beautiful, and affordable trip for many travellers, with a lot of interest in the beaches and party lifestyle.
Here are some interesting Thailand tourism statistics:
- 23% of Thai travellers choose a big chain or resort, making this their most popular accommodation type.
- The average length of stay in Thailand is 9 days.
- 44% of Thai travellers say they would never want cooking handled by a machine.
- Thailand aims to attract 40 million international trips and 220 million domestic trips in 2025.
- Thailand tourism expenditure is expected to reach USD15.8 billion in 2029.
Business travel statistics
Prior to COVID-19 business travel was a booming industry unto itself, with some hotels operating almost exclusively for corporate guests. It’s now starting to make a recovery and should be considered again when hoteliers are forming their strategies.
Here are some top business travel statistics:
- 78% of business travel is solo travel.
- 73% of business travellers list flight delays as their main concern when travelling.
- 54% of business travellers would appreciate real-time travel notifications.
- The business travel sector will reach a value of US$829.5 billion within the next 4 years.
- Chinese travellers top the charts for biggest spenders on business travel.
Leisure travel statistics
Leisure travel is impossible to keep down – it’s in our human DNA to explore the world and see new places. Even when economic blips come along, the overall trajectory of the sector is always one of growth.
Here are some global leisure travel stats to be aware of:
- 26% of global travellers begin their research on a search engine like Google, making it an important focus for hoteliers.
- 87% of hotel guests are willing to spend money beyond the cost of their room.
- 52% credit staff as the main reason they would return to the same accommodation.
- 53% of respondents list ‘an easy, secure booking and payment process’ as a top three priority
- Only 14% say their chosen property is ‘simply a place to sleep’

Jon Murphy,
Consultant Revenue Director
Kaleidoscope Collection
Tourism and travel reports
Travel and tourism reports provide comprehensive analysis of various aspects of the travel and hotel industry, providing valuable insights into trends, traveller behaviour, and economic impacts. These reports are usually compiled by government organisations, industry associations, research firms, consulting companies, and other providers that work within or to support the industry.
Hotels can use these reports to gain, sometimes exclusive, insights into the market, guest data, and economic conditions. This can be extremely beneficial in knowing what approach the hotel takes to sales, marketing, revenue management, and guest experience.
Here are a couple of examples that are released annually which your hotel will gain a lot of value from.
-
Changing Traveller Report
SiteMinder’s Changing Traveller Report asks 10,000 travellers, across 12 countries, 25 questions about their travel plans, preferences, and motivations.
It’s the largest accommodation-specific survey globally and offers your hotel analysis into the responses by generation, travel plans, household income, travel companions, work plans and preferred accommodation types.
Learn more about it here and download a free plan to help you action the data.
-
Hotel Booking Trends
SiteMinder’s Hotel Booking Trends analyses more than 125 million reservations across 53,000 hotels to discover key booking statistics.
It identifies trends like the most popular booking channels, which sites produce the most revenue for hotels, average traveller lead times, cancellation rates, length of stay, and more.
The data can be viewed on a country-by-country basis and is also backed by commentary from industry experts.