What are hotel industry statistics?
Hotel industry statistics refer to data and metrics relating to hotels and other accommodations in the industry.
Hotel statistics may include occupancy rates, revenue figures, guest statistics, cancellation rates, booking channel statistics and more.
This kind of data is invaluable for hoteliers who want to analyse performance, benchmark, forecast, and plan strategically to ensure business success.
This blog will cover some of the must-know hotel industry statistics for hotels today. Table of contents
Hotel statistics that matter in 2024
The travel industry is set for strong recovery in 2024, which is good news for hoteliers, with some positive statistics already showing up.
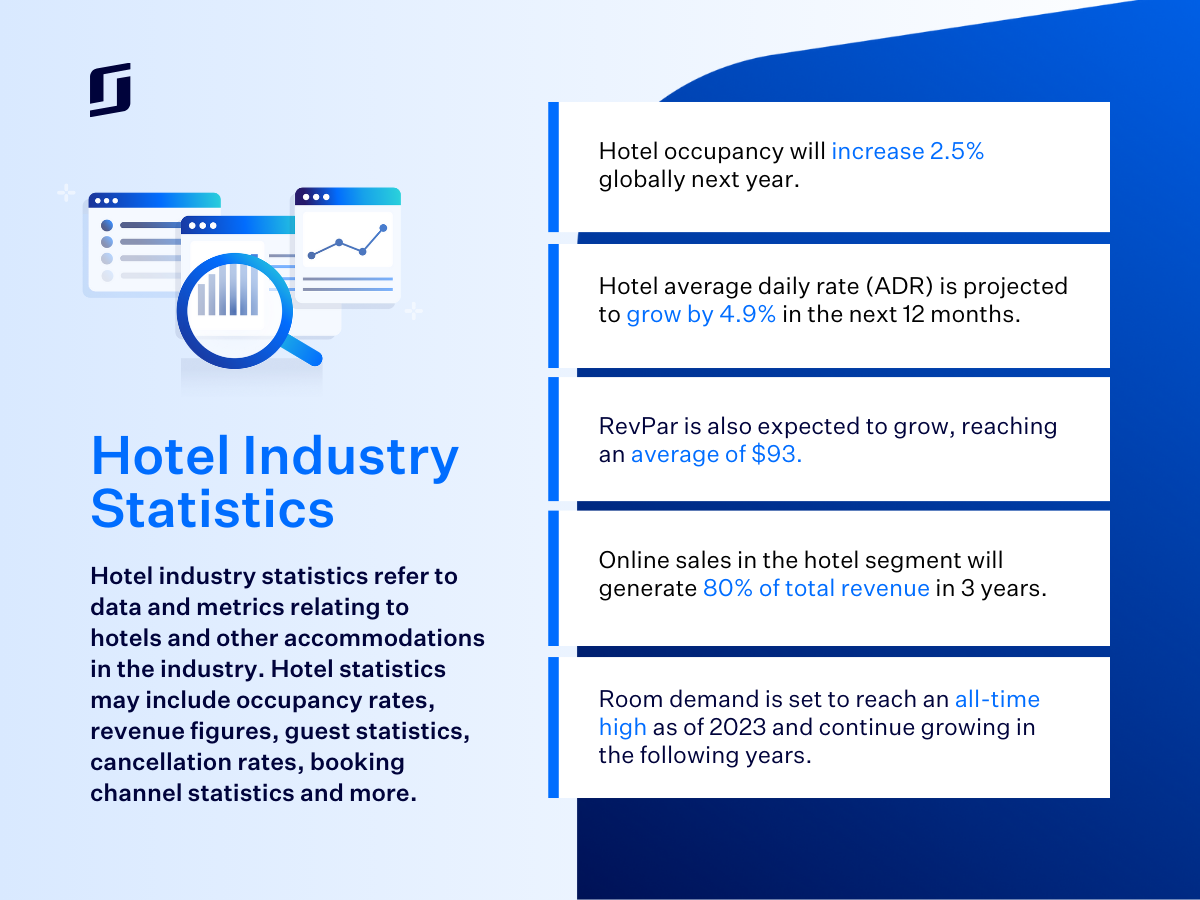
- Hotel occupancy will increase 2.5% globally next year.
- Hotel average daily rate (ADR) is projected to grow by 4.9% in the next 12 months.
- RevPAR is also expected to grow, reaching an average of $93.
- Online sales in the hotel segment will generate 80% of total revenue in 3 years.
- Room demand is set to reach an all-time high as of 2023 and continue growing in the following years.
Be on the lookout for updates as the year progresses!
Global hotel industry statistics
Globally, there are a tonne of fascinating hotel industry statistics – too many to list. But here are five we think are useful plus a bunch from around the world.
- Online travel agencies make up the top two revenue generating positions in 79% of major destinations.
- Airbnb is quickly becoming a mainstay for hotels who want to drive additional revenue.
- The average booking lead time for hotels is 29.7 days.
- The average length of stay is 1.93 days.
- The average cancellation rate is 20%.
Turn statistics into hotel revenue
Make statistics mean something by using SiteMinder’s platform to implement effective revenue management strategies
Learn more
US hotel industry statistics
The top five revenue generating channels for hotels in the US are Booking.com, Expedia, hotel websites (direct bookings, Agoda, and Airbnb.
Here are some other key stats on the US hotel industry:
- The hotel market in the US is worth more than $106 billion.
- By 2027, more than 160 million ‘users’ will be a part of the hotel market.
- There are more than 90,000 hotels in the US.
- Average US occupancy rate is just under 65%.
- The U.S.’s accommodation industry employs about 1.6 million people.
UK hotel industry statistics
The top five revenue generating channels for hotels in the UK are Booking.com, Expedia, hotel websites, hotelbeds, and global distribution systems (GDS).
Here are more interesting hotel statistics from the UK:
- There are almost 900,000 rooms available in the UK.
- The most popular hotel brand in the UK is Premier Inn.
- Brighton & Hove has the highest average price at 133 British pounds.
- Hotel market revenue is worth close to $22 billion.
- 55% of UK adults have stayed in a hotel in the past 12 months.
Luxury hotel industry statistics
Luxury hotels are certainly an industry unto themselves, with the market worth $128.54 billion in recent years.
- The average daily rate (ADR) of luxury hotels in the United States is $320.82.
- Luxury properties are normally split into a few main categories; Business, Airport, Holiday, Resorts & Spas.
- 60% of luxury guests want an authentic experience that embodies the local culture.
- The luxury hotel market size has increased 5.9% in the last couple of years.
- The last 30 years, luxury hotel supply has increased by 191%.
Airbnb vs hotel statistics
Airbnb is a popular platform for travellers that is still growing. It’s now also a good distribution option for many hotels if they are small, unique, or boutique.
Here are some recent statistics for Airbnb vs hotels:
- Hotels are still preferred, with 68% of travellers choosing them.
- Gen Z is more likely to choose Airbnb properties, at 21%.
- Airbnb takes approximately $450 million away from the hotel industry each year.
- Only 10% of Airbnb bookings are for business travel.
- 60% of those who use Airbnb and comparable hotels, say they prefer Airbnb.
Hotel industry report: What are the best sources of hotel industry data?
There is no shortage of hotel industry reports available for hoteliers to use to gain a better understanding of market statistics and projections.
A few large organisations put out annual reports that look at stats, trends, and predictions, including:
- Hotel Industry Trends 2023 by STR – A comprehensive overview of the hotel industry, including key trends, market data, and forecasts for the future.
- Hotel Horizons by PwC – Examines the global hotel industry from 2023 to 2027, focusing on key trends, drivers, and challenges.
- Global Hotel Industry Market Report by Allied Market Research – Analysis of the global hotel industry, including market size, growth trends, key players, and future projections.
Other reports are done by different players in the industry, such as the leading technology providers like SiteMinder.
Hotel Booking Trends
SiteMinder’s Hotel Booking Trends analyses more than 115 million reservations across 40,000 hotels to discover key hotel statistics.
It identifies trends like the most popular booking channels, which sites produce the most revenue for hotels, average traveller lead times, cancellation rates, length of stay, and more.
It’s released on a global scale and can be segmented by country to, to give hotels unique insights into their own market.
Integrate to SiteMinder’s vast ecosystem
Connect to SiteMinder’s extensive network of technology systems and partners to maximise your efficiency, bookings, and revenue.
Learn More
Key hotel industry statistics to use this year
Every year brings some new challenges and slight changes in trends and stats that can affect the strategy of hotels.
Here some that should prove the most useful for your property:
Hotel loyalty program statistics
There’s a reason 94% of the world’s top 100 hotel brands and chains have a loyalty program – they’re extremely effective in driving revenue.
- Loyal customers spend 22.4% more and stay 28% longer.
- 64% of loyalty members are business travellers.
- Loyalty members contribute between 30-60% of room revenue
If you need tips, we’ve got a full guide to hotel loyalty programs.
Hotel occupancy rate statistics
Occupancy rates ebb and flow with seasonality, economic conditions, and global events, and are a very good indicator of market health as well as individual business prosperity.
- Some major cities could see occupancy rises by as much as 17.5% next year.
- Occupancy rebounded strongly in 2023, with many European destinations recording above 80-85% during summer.
- As of the final quarter of 2023, the global average was 69%.
Hotel booking statistics
Hotel booking statistics tell hoteliers where their bookings are coming from and how they should be prioritising their sales and marketing efforts.
- Booking.com is easily the most popular booking channel but direct bookings are top 3-5 choices for global travellers too.
- Mobile bookings make up almost a quarter of all hotel bookings.
- Almost 60% of all hotel bookings are now made online, a figure that has been steadily increasing.
Hotel revenue statistics
Revenue is the bottom line and it’s what all hotel stakeholders will be most interested in, making revenue trends a constant source of interest.
- Hotels and tourism typically make up 10% of worldwide GDP.
- An annual revenue growth rate of 4.2% is projected for the hotel market.
- The global average profit of hotels is expected to increase to 22% in the next couple of years.

Jon Murphy,
Consultant Revenue Director
Kaleidoscope Collection
Hospitality industry statistics
The hotel industry and hospitality industry are very much intertwined, so hospitality industry statistics certainly can impact hotel businesses.
In particular, employment in the industry is often a hot topic.
Hospitality industry employment statistics
More than 2.3 million people work in the hotel industry in the United States alone but during COVID the unemployment rate in hospitality jumped to almost 20%. It was one of the hardest hit industries at the time.
- In Australia, the rate of vacant positions is more than double what it was prior to the global pandemic.
- Only 28% of hospitality workers are on full-time hours.
- Of those who work full-time, their average hours are two hours less than the ‘all jobs’ average.
For hotels, employment and staffing is important because the interaction guests have with staff can make or break their stay, and it impacts the hotel’s reputation and revenue.
Here’s how to build and lead a team of hotel staff effectively.