What are hotel industry statistics?
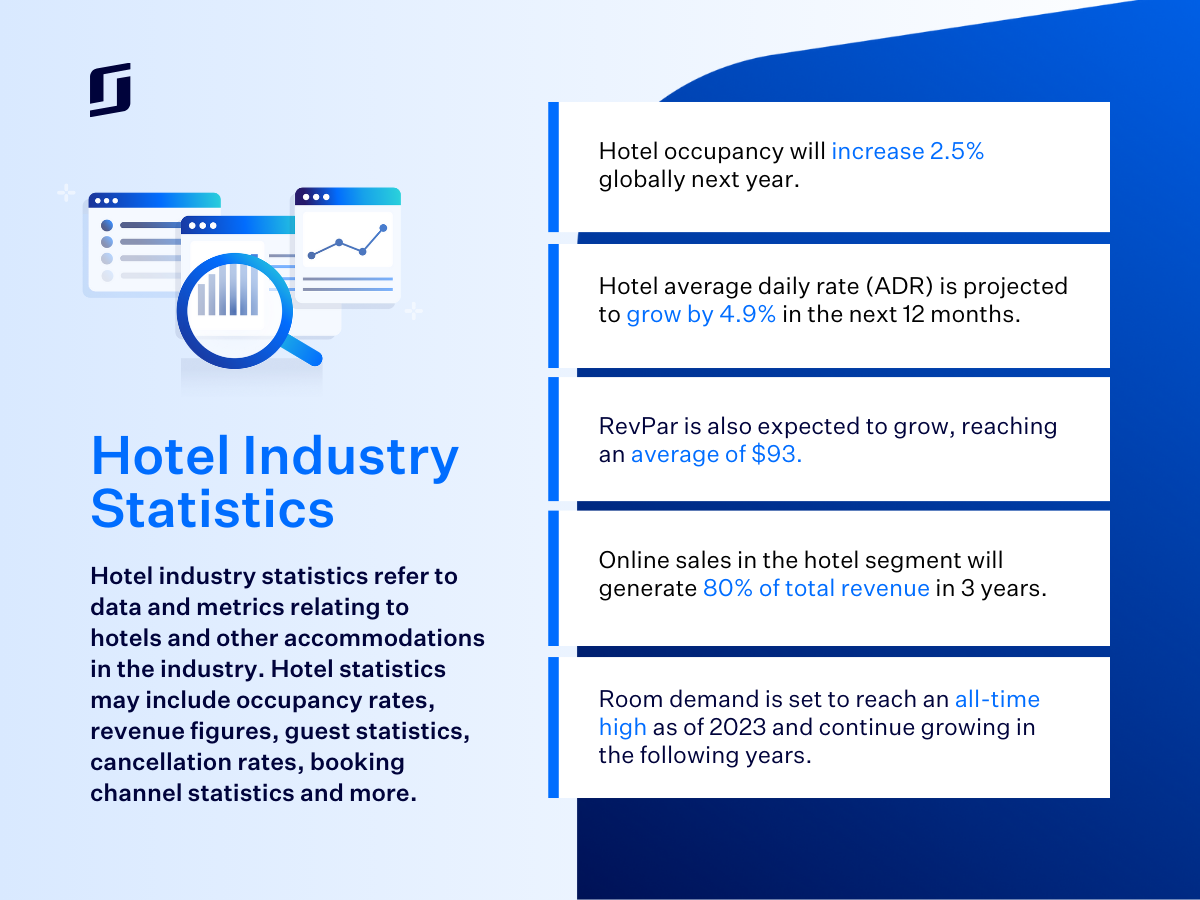
Hotel industry statistics refer to data and metrics relating to hotels and other accommodations in the industry.
Hotel statistics may include occupancy rates, revenue figures, guest statistics, cancellation rates, booking channel statistics and more.
This kind of data is invaluable for hoteliers who want to analyse performance, benchmark, forecast, and plan strategically to ensure business success.
This blog will cover some of the must-know hotel industry statistics for hotels today.
Table of contents
What are hotel statistics that matter in 2026?
The travel industry is moving from a period of rapid recovery into a phase of stability and differentiation in 2026, where success is defined by technological ROI rather than simple demand surges.
- Only 23% of hoteliers adjust rates daily despite hourly pricing shifts in the market, leaving revenue opportunities on the table. Learn more in our latest research report.
- Global hotel occupancy is projected to hold steady or dip slightly, with U.S. occupancy forecast at about 63% in 2025 and global occupancy expected to be in the high‑60s (around 68–70%) as new supply growth balances out cooling leisure demand.
- Global hotel performance in 2026 is forecast to rise modestly, with revenue growth driven mainly by rate rather than occupancy, and average daily rate (ADR) expected to increase by around 1–2% as consumers hit ‘peak price resistance’ and increasingly search for value over high‑cost bookings.
- In the US, RevPAR (Revenue Per Available Room) is forecast to edge up to around $103 in 2025, a modest ~3% year‑on‑year increase driven more by ADR than occupancy.
- Digital‑first planning now dominates: by 2028, online channels are expected to generate about 76% of travel and tourism revenue, and around nine in ten travellers use metasearch sites to compare hotel rates before choosing where to book.
- Room demand will be catalysed by “unmissable moments,” such as the 2026 FIFA World Cup, which is projected to generate nearly $900 million in incremental room revenue in North America.
Be on the lookout for updates as the year progresses!
What are the key global hotel industry statistics?
Globally, there are a tonne of fascinating hotel industry statistics – too many to list. But here are five we think are useful plus a bunch from around the world.
- Online travel bookings now account for 65% of all global travel bookings.
- Digital and contactless experiences are now mainstream: surveys show around 60% of travellers prefer hotels with contactless check‑in and mobile keys, and Marriott reports that over 70% of its guests now unlock rooms with a smartphone.
- ‘Bleisure’ travel has surged, with around 40% of business trips now being extended to include leisure timme
- Sustainability is now a core priority: 84% of travellers say that travelling more sustainably is important to them.
Turn statistics into hotel revenue
Make statistics mean something by using SiteMinder’s platform to implement effective revenue management strategies
Learn more
What are the key US hotel industry statistics?
In 2026 the top five revenue-generating channels for hotels in the US continue to be Booking.com, Expedia, hotel websites (Direct), Agoda and Airbnb.
Other key stats on the US hotel industry for 2026 include:
- In the United States, hotel market revenue was estimated at around $263 billion in 2024 and is forecast to reach nearly $396 billion by 2030.
- As of 2024, there were around 49,800 hotels and motels operating in the U.S.
- The average US occupancy rate is forecast to stabilise at 62%.
- The US hotel industry now supports approximately 2.1 million direct employees.
What are the key UK hotel industry statistics?
The top five revenue generating channels for hotels in the UK are Booking.com, Expedia, hotel websites, hotelbeds, and global distribution systems (GDS).
Here are more interesting hotel statistics from the UK for 2026:
- A forecast estimates that the UK will add nearly 83,000 hotel rooms nationwide by 2026.
- Premier Inn remains the UK’s most familiar hotel brand in consumer surveys.
- According to IBISWorld, UK hotel market revenue is forecast to reach around £27.5 billion in 2025–26, a record level for the sector.”
- 46% of UK travellers have already booked 2026 trips, with 71% seeking eco-friendly stays.
What are the key luxury hotel industry statistics?
Luxury properties are primarily categorised into four segments: business hotels, airport hotels, suite hotels and resorts. These hotels remain a high-growth segment within the hospitality world, as demonstrated by the following key stats for 2026:
- According to Allied Market Research, the global luxury hotel market was valued at around $113 billion in 2024 and is projected to reach about $181.5 billion by 2034.
- The global luxury hotel market is currently expanding at a compound annual growth rate (CAGR) of about 10.3% from 2024 to 2030, significantly outperforming the broader hospitality sector.
- In North America, the luxury segment’s RevPAR is growing at around 7.1%, while economy hotels are largely flat, underscoring how demand is concentrating at the top end of the market.
- Hotel supply growth remains measured: in the U.S., total room supply is forecast to increase by about 1.8% in 2026 as new projects come online.
Airbnb vs hotel statistics
Airbnb is a popular platform for travellers that is still growing. It’s now also a good distribution option for many hotels if they are small, unique, or boutique.
Here are some recent statistics for Airbnb vs hotels:
- 62% of travellers still prefer hotel stays over Airbnb and Vrbo.
- Airbnb primarily targets 18-40 year olds, digital natives and families.
- Prior to Airbnb controls being put in place in NYC, the platform was taking approximately $450 million away from the hotel industry each year in that city alone.
- Airbnb’s share of the business travel market surged from 28% in 2019 to 44% in 2024.
What is the best source of hotel industry data? A hotel industry report
There is no shortage of hotel industry reports available for hoteliers to use to gain a better understanding of market statistics and projections.
A few large organisations put out annual reports that look at stats, trends, and predictions, including:
- SiteMinder Changing Traveller Report 2025-2026: Essential reading for hoteliers to understand the mindset of the modern ‘everything traveller’.
- 2026 Global Hotel Study by STR (CoStar): STR remains the gold standard for benchmarking, and their 2026 outlook provides a comprehensive overview of average industry performance in key metrics.
- PwC Hospitality Outlook 2025-2026: Examines the global hotel industry with a focus on macroeconomic drivers and challenges.
- Global Hotel Industry Market Report by Allied Market Research: A broader look at market size and growth through to 2032.Hotel Industry
Changing Traveller Report
Further to the above, SiteMinder’s Changing Traveller Report offers key findings on how guests are changing their behaviours – invaluable knowledge for any hotel looking to futureproof its own existence.
For example, the report indicates that 78% of travellers are now open to using AI to plan and book their stays, showing how travel agents are fast becoming obsolete, and that hotels need to ensure they are named within AI-generated results.
52% of guests also intend to work during their next trip, blurring the lines between business and leisure travel, and indicating that a hotel should consider investing in dedicated meeting rooms and coworking spaces.
The report also highlights that while cost remains a factor, travellers are increasingly prioritising ‘experience-led’ stays over basic accommodation.
Hotel Booking Trends
SiteMinder’s Hotel Booking Trends analyses more than 125 million reservations across 40,000 hotels to discover key hotel statistics.
It identifies trends like the most popular booking channels, which sites produce the most revenue for hotels, average traveller lead times, cancellation rates, length of stay, and more.
It’s released on a global scale and can be segmented by country to, to give hotels unique insights into their own market.
Integrate to SiteMinder’s vast ecosystem
Connect to SiteMinder’s extensive network of technology systems and partners to maximise your efficiency, bookings, and revenue.
Learn More
What are the key hotel industry statistics to use for your property?
The key hotel industry statistics for your property will depend on your current situation and goals. If you’re looking to establish yourself in the market, average hotel KPI stats are useful. If you’re looking to grow or futureproof your business, statistics on market trends and guest behaviours are ideal.
Stats that could prove useful for your property include:
Hotel loyalty program statistics
There’s a reason 94% of the world’s top 100 hotel brands and chains have a loyalty program – they’re extremely effective in driving revenue.
- Loyal customers spend 22.4% more and stay 28% longer.
- Loyalty programs can boost customer retention rates by up to 25%.
- Top Loyalty programs can increase sales by 15-25% per year.
- Businesses that offer loyalty programs see a 20% increase in customer visits.
If you need tips, we’ve got a full guide to hotel loyalty programs.
Hotel occupancy rate statistics
Occupancy rates ebb and flow with seasonality, economic conditions, and global events, and are a very good indicator of market health as well as individual business prosperity.
- In 2025, US lodging occupancy reached 63.38% which almost closed the gap to 2019 levels.
- In peak season (July 2025) occupancy in top US destinations reached ~68.2%.
- In mid-2024 global average occupancy sat at 60.3%, within a single percentage point of pre-COVID norms.
- Beach destinations in Mexico are performing far above the global average.
Hotel booking statistics
Hotel booking statistics tell hoteliers where their bookings are coming from and how they should be prioritising their sales and marketing efforts.
- Booking.com is easily the most popular booking channel but direct bookings are top 3-5 choices for global travellers too.
- The amount of direct bookings through hotel websites and apps is growing, with 66% of millennials preferring this reservation method.
- 60% of hotel bookings are now made online.
Hotel revenue statistics
Revenue is the bottom line and it’s what all hotel stakeholders will be most interested in, making revenue trends a constant source of interest.
- Hotels and tourism typically make up 10% of worldwide GDP.
- An annual revenue growth rate of 4.2% is projected for the hotel market.

Jon Murphy,
Consultant Revenue Director
Kaleidoscope Collection
What are the key hospitality industry statistics?
The hotel industry and hospitality industry are very much intertwined, so hospitality industry statistics certainly can impact hotel businesses.
In particular, employment in the industry is often a hot topic.
Hospitality industry employment statistics
As of 2024, U.S. hotels directly employ just over 2.15 million people, still below their 2018–19 peak despite adding back more than 467,000 jobs since Covid, and ongoing staffing shortages remain a drag on growth.
- The global hospitality and tourism sector now supports roughly 371 million jobs.
- Over the next decade, the travel and tourism sector is projected to generate 91 million new roles, equal to one third of total new jobs created worldwide.
- Persistent labour shortages have led hoteliers to technology, with 30% increasing their investment in automation over the last six months.
For hotels, employment and staffing is important because the interaction guests have with staff can make or break their stay, and it impacts the hotel’s reputation and revenue.
Here’s how to build and lead a team of hotel staff effectively.